An important decision that a trader needs to make in which option he should trade – in the money, at the money, or out of the money.
Among other things, a trader must also consider the premium of these three options in order to make an educated decision. There are two components in the option premium .
Intrinsic value and time value .If the option is deeply in the money , the intrinsic value will be higher and so is the option value/premium. In case of at the money or out of the money options there is no intrinsic value but only time value. Hence , these options remain cheaper compared to in the money options . Therefore, option buyer pays higher premium for in the money option compared to at the money or out of the money options and thus, the cost factors largely influences the decision of an option buyers.
For, ATM options, the uncertainty is highest as compared to ITM OR OTM options. This is because we known that when an option is ITM OR ATM, even if the price moves somewhat, in any direction, still the option will largely remain ITM OR OTM as the case may be.
But in case of ATM options even a small price movement in either direction can tip the option from ATM to ITM or OTM. There is a huge uncertainty here and this uncertainty is a function of time to expiry and volatility of the underlying, both of which are captured in the time value.
DELTA: The most important of the Greeks is the option’s delta . this measure the sensitivity of the option value to a given small change in the price of the underlying asset . it may also be seen as the speed with which an option moves with respect to price of the underlying asset . delta = change in option premium/ unit change in price of the underlying asset .
GAMMA : It measures change in delta with respect to change in price of the underlying asset . this is called a second derivative option with regard to price of the underlying asset. It is calculated as the ratio of change in delta for a unit change in market price of the underlying asset . GAMMA = change in an option delta/unit change in price of underlying asset.
THETA : It is measure of an option sensitivity to time decay . theta is the change in option price given a one –day decrease in time to expiration . it is a measure of time decay. Theta is generally used to gain an idea of how rime decay is affecting your option positions. THETA= change in an option premium/ change in time to expiry.
VEGA : This is a measure of the sensitivity of an option price to changes in market volatility . it is the change of an option premium for a given change in the underlying volatility . VEGA= change in an option premium/change in volatility.
RHO : Rho is the change in option price given a one percentage point change in the risk – free interest rate . rho measures the change in an option price per unit increase in the cost of funding the underlying .
RHO = change in an option premium/change in cost of funding the underlying .
Dear market participants, nifty took strong support at 24200 , 200points recovery from today’s low and closed at 24,406. For next trading session we have to look for following points.
FII’s bought 62,416 index future and in options they bought 47Lso they are bullish l in derivatives. In stock they sold 2605cr so indicating bearish .
DII’s sold 78,669 index future and in options they sold 2.95L. in stock they bought 2,432 Cr
Clients are medium bullish in future and in options they are indecisive.
If we look at Global markets, US markets are positive , European markets are bearish and Asian markets are also negative
Volatility index rose 27% , that closed at 12.62 .
As per open interest nifty has 24300 followed by 24200 and also 24000 has highest put writer . there is call writer at 24500 followed by 24600.
This month nifty closed above 24000 and below 24500. For next month these two levels act as main points . for intraday 24200 will be act as strong support and in upside 24500 as resistance after today’s sessions probability of downtrend from this level in low but fed interest rate decision will be there on 31st July up to that if any stock specific news may affect the market.
ASHOK LEYLAND;; Resignation of Mr Dr. C Bhaktavatsala Rao as Non- Executive Director of the company w.e.f. July 31, 2024
Co. Says Ashok Leyland’s domestic MHCV volume grew by 8% and market share was at 30.7%. The bus market share was significantly up at 33.3%.
The Company’s domestic LCV volume in Q1 FY’25 was 15345 units, 4% higher than Q1 of last year (14821 units). The Company’s Export volume in Q1 FY’25 was 2324 units, 5% higher than Q1 of last year (2222 units).
EBITDA is up at 10.6% for Q1 FY25 (Rs. 911 Cr) as against 10.0% (Rs. 821 Cr) in Q1 of previous year. Net Debt to Equity ratio stood at 0.1 at the end of Q1’FY25.
The Company continued to see strong demand in all its business units.
While the Company achieved its highest ever Q1 CV volumes, the Power Solutions, Aftermarket, Defence business and the International Operations also contributed strongly to the top line. The efforts on product and network expansion helped the uptick in revenue and market share.
CANARA BANK Q1
Canara Bank reported a Net Interest Income (NII) of Rs 9,166 crore. The net interest earned increased by 14.8%, reaching Rs 28,701.35 crore in Q1FY24, compared to Rs 25,004.07 crore during the same period in the previous fiscal year.
Canara Bank on Thursday recorded fiscal first quarter earnings with standalone profit at Rs 3,905.28 crore, up 10.5 per cent in comparison to Rs 3,534.84 crore recorded during the corresponding quarter of previous financial year, missing estimates.
The net interest earned was at Rs 28,701.35 crore, up 14.8 per cent as against Rs 25,004.07 crore during Q1FY24. The Bank recorded Net Interest Income (NII) at Rs 9,166 crore.
On a consolidated basis, Q1 profit was at Rs 3,977.22 crore, up 11.3 per cent as against Rs 3,573.50 crore during the same period last year.
Clinitech Laboratory Limited IPO will be open for subscription from 25-jul-2024 to 27-jul-2024.
Here is a brief information about the company and IPO.
Application start– 25-07-2024
Application end– 29-07-2024
Allotment begins– 30-07-2024
Refund Initiation– 31-07-2024
Allotment date– 31-07-2024
Listing on exchange– 01-08-2024
About Clinitech Laboratory Limited
About Clinitech Laboratory Limited
Founded in 1990, Clinitech Laboratory Limited operates a network of eight diagnostic centers strategically located in Thane and Navi Mumbai, offering a comprehensive range of diagnostic and healthcare tests. Annually, they conduct more than 3 lakh tests in their NABL (National Accreditation Board for Testing and Calibration Laboratories) accredited labs, equipped with advanced technology and high-end equipment. These tests span across various disciplines including Biochemistry, Immunology, Hematology, Molecular Biology, Serology, Microbiology, and Histopathology, enabling precise diagnosis and effective treatment planning.
Clinical pathology forms the core of their services, focusing on the analysis of bodily fluids and tissues to diagnose diseases and conditions. Their laboratories perform crucial tests such as blood tests, urine analysis, and tissue biopsies, which are essential in understanding the underlying causes of symptoms and guiding healthcare decisions. Their team of clinical pathologists plays a pivotal role in interpreting test results and providing valuable insights to aid in patient care.
Looking ahead, they anticipate potential competition from new entrants with established business networks, posing threats to their market share. Such competitors may leverage larger financial resources for enhanced marketing and service delivery capabilities. Despite these challenges, Clinictech Laboratory Limited is poised to uphold its leadership in diagnostic and healthcare services through strategic management practices, technological innovation, and a steadfast commitment to meeting the evolving needs of their clientele.
As Clinitech Laboratory Limited prepares for its Initial Public Offering (IPO), the proceeds from the Fresh Issue will be allocated towards critical objectives:
Expansion of Diagnostic Centres;
General Corporate Purposes
Total Offer Size- 6,02,400 Equity Shares at the Offer Price of ₹ 96 each aggregating ₹ 578.30 Lakhs.
Fresh Issue Size- 6,02,400 Equity Shares at the Offer Price of ₹ 96 each aggregating ₹578.30 Lakhs
THERE ARE FIVE FUNDAMENTAL PARAMETERS FOR OPTION PRICING MODEL
SPOT PRICE OF THE UNDERLYING ASSET – The option premium is affected by the price movements in the underlying instrument . If price of the underlying asset goes up the value of the call option increase while the value of the put option decrease, vice-versa ..
STRIKE PRICE – If all the others factors remain constant but the strike price of option increases , intrinsic value of the call option will decrease and hence its value also decrease . on the other hand , with all the other factors remaining constant , increase in strike price of option increases the intrinsic value of the put option which in turn increases its option value.
VOLATILITY – It is the magnitude of movement in the underlying assets price , either up or down . It affects both call and put options in the same way . Higher the volatility of the underlying stock, higher the premium because there is greater possibility that the option will move – in – the – money during the life of the contract.
TIME TO EXPIRATION – The effect of time to expiration on both call and put options is similar to that of volatility on option premiums . generally , longer the maturity of the option greater is the uncertainty and hence the higher premiums . If all other factors affecting an option’s price remain same , the time value portion of an option’s premium will decreases with the passage of time . This is also known as time decay . Options are known as ‘wasting assets ‘ , due to this property where the time value gradually falls zero
INTEREST RATES – Interest rates are slightly complicated because they different options, differently. For example, interest rates have a greater impact on options with individuals stocks and indices compared to options on futures . To put it in simple way high interest rates will result in an increase in the value of call option and a decrease in the value of a put option.
Dear market participants, Nifty fell 0.27% , closed at 24413. tomorrow there is monthly expiry for nifty. so we must look following data for an intraday trades.
FII’s bought 2.4 lakhs index future and in options they sold 1.08L so they are bearish l in derivatives. In stock they sold 5,131 cr so indicating bearish .
DII’s sold 76,479 index future and in options they sold 3.85L. in stock they bought 3,137cr.
Clients are Indecisive in future and in options they are bullish.
If we look at Global markets, US markets are very bearish , European markets and Asian markets are also negative
Volatility index fell 7.73% , that closed at 11.76.
As per open interest nifty has 24300 followed by 24000 has highest put writer . there is call writer at 24500 followed by 24600.
Because of monthly expiry tomorrow there will be volatility in nifty. For expiry trade important points are 24300 as support level and 24500 as resistance. If markets breaks support level it has high probability to move up to 24100 followed by 24000. If nifty breaks resistance then next hurdle in upside is 24666 . chance of consolidate between 24300 to 24600 is less on tomorrow’s trading session.
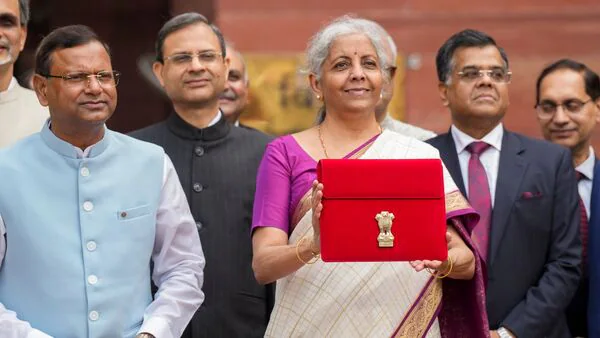
Dear market participants , today as usual on union budget market would be very volatile, so nifty was very volatile. Now budget got over uncertainty about taxations and all clear now. So, now we have to consider few points for next trading day.
FII’s bought 2.83 lakhs index future and in options they sold 89,287 so they are bearish l in derivatives. In stock they sold 2975cr so indicating bearish.
DII’s sold 78,322 index future and in options they sold 3.83L. in stock they bought 1419cr.
Clients are bullish in future and in options too.
If we look at Global markets, US markets are medium bullish, Europe markets are negative and Asian markets are mixed
Volatility index fell 43%, that closed at 12.75. because big event got over so it fell most today.
As per open interest nifty has 24100 followed by 24000 has highest put writer, there is call writer at 24600.
On today’s budget long term and short term capital gain tax increased and STT for F&O segment also hiked. so this is negative for market but it nifty recovered from day low that is 24091. so, 24100 will act as strong support and 24666 will be resistance. for next trading session probability of consolidation between these two level is high. If any of this level breaks. There is chance of trend continuation on same side.