Learning technical skills is a endless process. One of the most commonly used tool for technical analysis is RSI(Relative Strength Index). In this blog we learn about it and it’s wrong assumptions.
RSI (Relative Strength Index) is a momentum oscillator that measures the speed and magnitude of recent price changes to evaluate overbought or oversold conditions in a market. It was developed by J. Welles Wilder and ranges from 0 to 100.
How RSI Works
Interpretation:
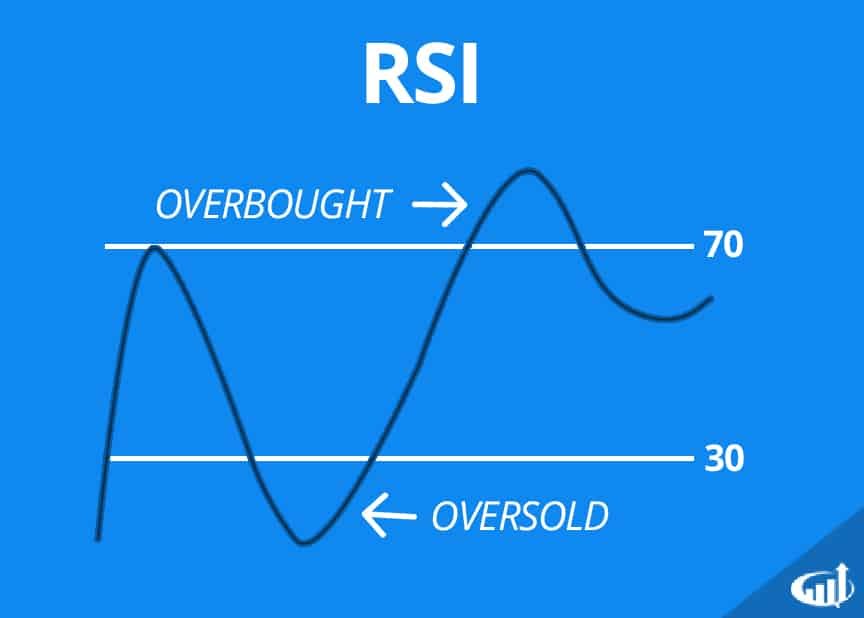
Above 70 → Overbought (potential for a pullback or reversal)
Below 30 → Oversold (potential for a bounce or reversal)
Between 30–70 → Neutral or trending
Divergence:
Bullish Divergence → Price makes a new low, but RSI makes a higher low (possible upward reversal)
Bearish Divergence → Price makes a new high, but RSI makes a lower high (possible downward reversal)
Midline (50) Cross:
RSI > 50 → Bullish momentum
RSI < 50 → Bearish momentum
How to Use RSI Effectively
Trend Confirmation:
RSI > 70 in an uptrend can mean strength, not necessarily overbought.
RSI < 30 in a downtrend can signal strong bearish momentum.
Overbought/Oversold Strategy:
Buy when RSI moves from below 30 to above 30.
Sell when RSI moves from above 70 to below 70.
Divergences:
Bullish divergence → Potential to buy.
Bearish divergence → Potential to sell or short.
Failure Swings:
Bullish failure swing = RSI crosses 30, makes a higher low, then breaks above the previous high → Buy signal
Bearish failure swing = RSI crosses 70, makes a lower high, then breaks below the previous low → Sell signal


 VWAP complete guide.
Leave a Reply
Want to join the discussion?Feel free to contribute!